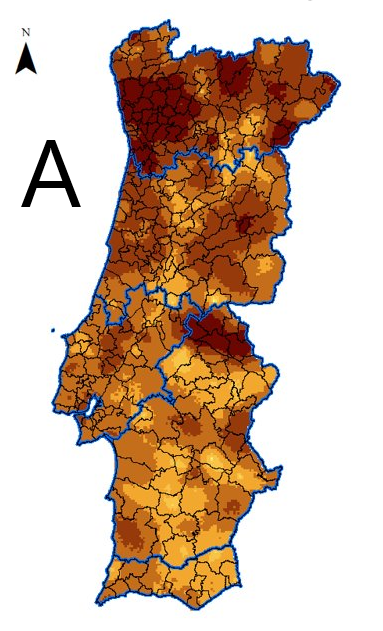
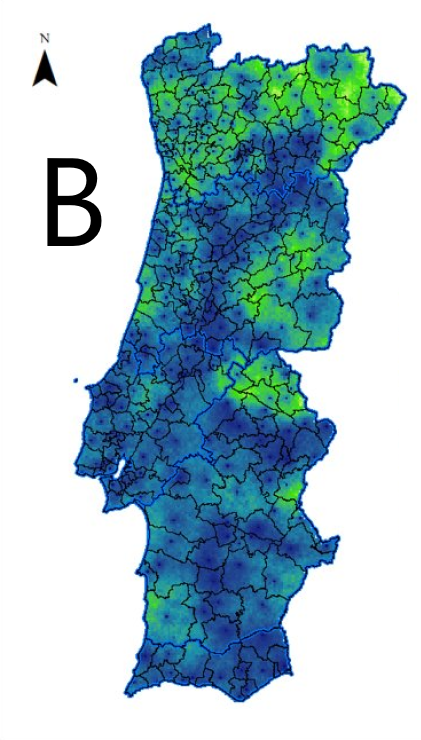
Dataset A - Inputs
Daily incidence rates (and respective uncertainty) per pixel in the entire Portuguese territory from 2020-03-01 to 2021-02-28. These inputs correspond to real data at a grid level.
We monitor and model the COVID-19 infection spread in Portugal. In this website you will find:
Europe was hit hard by the COVID-19 pandemic and Portugal was one of the most affected countries, having suffered three waves in the first twelve months. Approximately between Jan 19th and Feb 5th 2021 Portugal was the country in the world with the largest incidence rate, with 14-days incidence rates per 100,000 inhabitants in excess of 1000. Despite its importance, accurate prediction of the geospatial evolution of COVID-19 remains a challenge, since existing analytical methods fail to capture the complex dynamics that result from both the contagion within a region and the spreading of the infection from infected neighboring regions.
Spatial Data Sciences can provide significant insights into explaining spatial patterns of infectious diseases, understanding and predicting spatio-temporal transmission dynamics, predicting and monitoring the impact of control interventions, which are driven by geographical factors, designing and evaluating optimal resources allocation strategies and cost-effectiveness analyses that incorporate a spatial component and analysing inequities in healthcare based on geography. SCOPE project aims at demonstrating that spatial data sciences can be successfully used to deliver a functional software prototype for spatial risk management during epidemic events delivering to health public administration new capabilities to prepare and respond in a short amount of time. This project combines Machine Learning, high performance computing and information visualization to manage big data.
The multidisciplinary team aims to answer the following five main questions:
- Where is the disease spreading to?
- How fast the disease is spreading?
- How can mobility data improve disease predictions in space?
- How to visualize maps of health variables and the associated uncertainty?
- What information can the high-resolution maps provide for faster and better decisions?
SCOPE's aim is to produce daily updates of health indicators maps and the uncertainty associated to the spatial predictions, retrieving the history of the COVID-19 pandemic. The potential for understanding the spatial patterns, especially during the mitigation and endemic phases, is huge bringing insights on the spatial dispersion of the disease over time.
Furthermore, also based on the historical maps, functional data analysis aims to build spatio-temporal models that in turn, are explored and analysed by public health experts to bring meaning and utility to their use and to define a subset of health indicators to use in spatial risk management of the disease.
There are two more projects with focus in the forecast of COVID-19 based on geostatistics. These are the INTAKE and Smock.
This project improves existing computational models for the geographical spread of COVID-19. The integration of detailed mobility information, mobility indexes and machine learning methods that lead to a new model for the spread of the epidemic, which is more precise and relevant than existing models. In order to achieve higher precision modeling of the pandemic spread, we aim to use a previously developed methodology (Azevedo et al., 2020) and official municipality level data from the Portuguese Directorate-General for Health (DGS), relative to the first twelve months of the pandemic, to compute an estimate of the incidence rate in each location of mainland Portugal. The resulting sequence of incidence rate maps is used as a gold standard to test the effectiveness of different approaches in the prediction of the spatial-temporal evolution of the incidence rate.
In this effort, a team of experts in geodata sciences, epidemiology, public health, computer science and decision sciences in health develop tools to inform management of the current pandemic crisis, and provide knowledge for future events. The objective is to develop geostatistical spatial models of daily infection risk by COVID-19 that consider daily infection prevalence and incidence, the resident population at parish and municipal level, and mobility between municipalities. There is also a focus on analyzing the temporal evolution of (past) spatial patterns of risk of COVID-19 infection, its relations with explanatory factors, such as socio-economic factors, health supply and policy actions taken by local and national authorities and evaluation of impact and effectiveness of implemented measures. This project uses public data of confirmed COVID-19 cases and socio-economic and health supply. Other data sources may be included, as the project gathers insights from public health experts. Several types of uncertainty are known to affect data and therefore analyses, for instance municipalities with small populations, data coding issues and time delays in reporting. However geostatistical methodologies are suitable for incorporating those uncertainties in spatial analysis of structured phenomena . The project aims to demonstrate the benefits of using spatial models to assess the effectiveness of the measures to prevent virus propagation during all stages of the pandemic, to balance demand and supply of medical resources required to control the disease and learn lessons ahead of any possible second or third epidemic waves, while developing a vaccine.

Daily incidence rates (and respective uncertainty) per pixel in the entire Portuguese territory from 2020-03-01 to 2021-02-28. These inputs correspond to real data at a grid level.
The forecasted incident rates by each model. This data corresponds to the predictions of 6 months at the grid level.
We make available the implementations for the prediction models used during this work through the following GitHub repositories.
The STConvS2S, ARMA and VAR models receive as input the incidence rate data in the form of a X by Y matrix, provided by dataset A, and are available here.
Geostatistical COVID-19 infection risk maps for Portugal, Leonardo Azevedo, Maria João Pereira, Manuel C. Ribeiro and Amílcar Soares, in International Journal of Health Geographics, 2020 [here]
Modeling the Geospatial Evolution of COVID-19 using Spatio-temporal Convolutional Sequence-to-sequence Neural Networks, Mário Cardoso , André Cavalheiro, Alexandre Borges, Ana Filipa Duarte, Amílcar Soares, Maria João Pereira, Nuno Jardim Nunes, Leonardo Azevedo, Arlindo Oliveira, in ACM Transactions on Spatial Algorithms and Systems, 2022 [here]
Spatiotemporal evolution of COVID-19 in Portugal’s Mainland with self-organizing maps, Igor Duarte, Manuel C. Ribeiro, Maria João Pereira, Pedro Pinto Leite, André Peralta-Santos and Leonardo Azevedo, in International Journal of Health Geographics, 2020 [here]
A Stochastic Model of an Early Warning System for Detecting Anomalous Incidence Values of COVID-19, Ana Filipa Duarte, Amílcar Soares, Maria João Pereira, André Peralta-Santos, Pedro Pinto Leite and Leonardo Azevedo, in Mathematical Geosciences, 2023 [here]
EpiGeostats: An R Package to Facilitate Visualization of Geostatistical Disease Risk Maps, Manuel Ribeiro, Leonardo Azevedo and Maria João Pereira, in Mathematical Geosciences, 2023 [here]